For the record I have just posted a question on User Experience stack exchange regarding polyline tools. The polyline tool will be the underlying tool for curved lines and arrows.
932 2014-09-27 11:58:12
Re: Experimental version - 0.8.22 (10 replies, posted in General)
dekigr wrote:
it is nace to hear about new version. Do you add some more graphic elements?
Thanks for the heads up, I'll look into adding arrow tools this week.
933 2014-09-21 18:57:48
Re: Experimental version - 0.8.22 (10 replies, posted in General)
Hi,
I think both issues are addressed in the next version 0.8.23.
It has been ready for quite a while to be honest, I was waiting for more feedback.
The changes related to your comment:
- there is now an embedded plot window,
- the time values for it are in milliseconds so its always numeric,
- other values have three decimal places,
- you can export the graph or the raw data to a file or copy it to the clipboard.
- The data is exported as .csv for maximum compatibility.
934 2014-09-16 18:39:05
Re: Improve tracking (2 replies, posted in Bug reports)
Hi,
Yes good markers will go a long way to improve tracking, especially in case of complex background.
If you are not using version 0.8.22 already then I suggest you try it because it lets you can change the size of the tracking windows (object window and search window).
For the marker design themselves, if size permits, you can use two concentric black and white rings, a bit like an archery target only with black and white stripes. The ring shape is to make them invariant to rotation.
If the video is already on YouTube you can add it like this for example:
[video]https://www.youtube.com/watch?v=20wOlps_Nj0[/video]935 2014-07-26 20:19:13
Re: Experimental version - 0.8.21 (29 replies, posted in General)
I uploaded a fixed version of the tool (it is dynamically loaded at run time).
Please check this dedicated topic.
936 2014-07-26 20:16:49
Topic: Fixed "Angle to horizontal" tool (for 0.8.21, 0.8.22) (0 replies, posted in Bug reports)
A bug on the Angle to horizontal tool has been reported by samfuen (thanks !).
The bug affects versions 0.8.21 and 0.8.22, possibly older versions.
A corrected version of the tool is available here : 8 - Angle to horizontal.xml
Fixing your Kinovea is simple, download the file and replace the old one in the installation directory, sub directory DrawingTools.
For instance: C:\Program Files\Kinovea\DrawingTools\ or C:\Program Files (x86)\Kinovea\DrawingTools\ for 64bit systems.
937 2014-07-26 11:55:35
Re: Experimental version - 0.8.21 (29 replies, posted in General)
samfuen wrote:
Hello, I have a problem in kinovea 08.21, because horizontal angle not working. What I should do?. Thanks
Hello,
I assume you are referring to the "Angle to Horizontal" tool. I reproduce a problem where moving the central point causes the drawing to disappear (reference line collapse to a single point). Is it the problem you are experiencing as well ?
Strangely enough the Angle to Vertical tool is not affected. I'll see where the problem is.
938 2014-07-19 20:10:39
Re: Tablet Dell Venue 8 Pro : See only an image section (6 replies, posted in Cameras and hardware)
It seems the issue may come from the tablet (camera drivers probably).
I found this topic "Dell Venue 8 Pro Camera Resolution changes during video chat" on the Dell forums which despite the title seems to describe your issue.
Also:
Dell Venue 8 Pro: Front camera using Skype or Google Hangouts is super zoomed in
The issue apparently is with desktop apps, not Metro apps. Other posts report color mangling with Google Hangouts.
By the way, do you reproduce the issue with the back camera ?
939 2014-07-16 13:39:03
Re: Tablet Dell Venue 8 Pro : See only an image section (6 replies, posted in Cameras and hardware)
What version of Kinovea are you using? In recent versions you should be able to tap and drag the picture around and double tap to cycle between fitting the screen and 1x zoom.
Does the picture fill the capture screen but is so large that you cannot see the sides? Or is it that the picture is displayed inside a small rectangle within the capture screen?
On the desktop CTRL+Mouse wheel is bound to zooming. I don't know if the pinch gesture is emulating this or sending its own commands.
I cannot test for touch screens at the moment, I'll see if I can find an emulator somehow.
940 2014-07-16 12:47:32
Re: Tablet Dell Venue 8 Pro : See only an image section (6 replies, posted in Cameras and hardware)
Try to double tap the image to make it fit the screen.
941 2014-07-15 13:18:09
Re: Logitech C920 - Cameras speed (fps) unstable when using two webcams (27 replies, posted in Cameras and hardware)
As an experiment you can also test the camera simulator (just added in 0.8.22). From the Camera tab, click on "Manual connection" button. In the "Type of camera" combo, choose "Camera simulator" and click "Create camera". Create two of them and go into dual camera mode.
From their configuration you can set them to HD 720 @ 30fps for example, and see if the framerate stays stable, with and without recording.
942 2014-07-14 11:50:32
Re: Logitech C920 - Cameras speed (fps) unstable when using two webcams (27 replies, posted in Cameras and hardware)
Hi,
I would say this indicates that the dual recording is too CPU intensive and both playback and recording can't happen in real time.
Can you try with two webcams of different models ? There might be an additional complication with using two cameras of the same model.
943 2014-07-14 11:24:39
Re: Let's tackle lens distortion (9 replies, posted in General)
Distortion correction in action in a less rigorous setting.
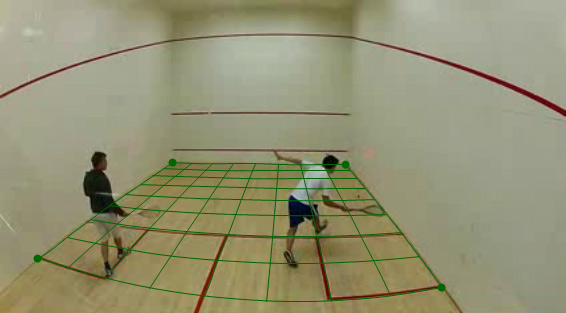
Fig 1. Plane mapping on a video from a different camera and at different resolution than the camera used to compute the distortion coefficients.
Here for example I have downloaded a squash video off YouTube in a crappy resolution (426×240). The only thing I know about the video is that it was filmed with a GoPro at the "Wide" setting (170°).
I imported distortion coefficients from my own camera and added a grid tool (in green) simply placing its four corners at field marks. Even though the cameras used are not the same, the grid tool can still be used if the required accuracy is not down to the centimeter. For example coordinates of points on the grid could be used to create a heat map of foot positions (and see how "hot" is the T for a particular play).
For better accuracy the calibration should be done on the same camera. The assembly process introduces small differences from one camera to another.
944 2014-07-14 10:01:13
Re: Let's tackle lens distortion (9 replies, posted in General)
More progress, almost done:
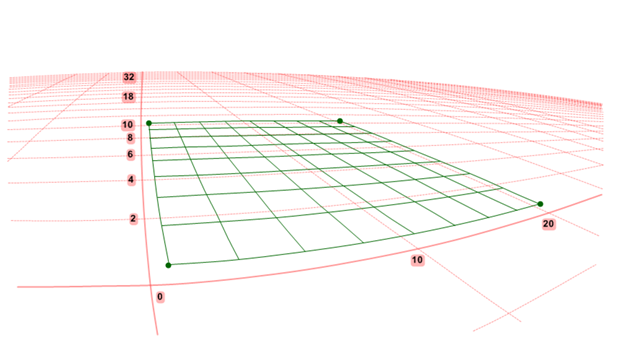
Fig1. Final coordinate system with perspective and distortion correction.
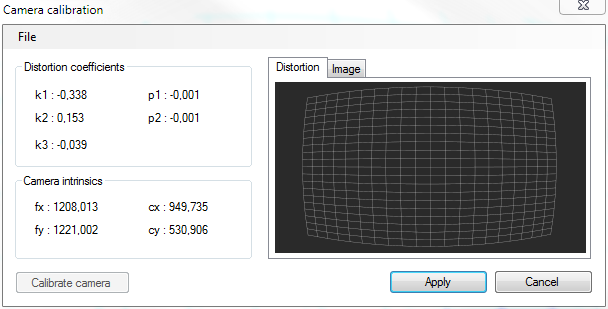
Fig 2. The camera calibration dialog. Here the coefficients correspond to a GoPro Hero 2 in Medium mode (127°).
Basically there are two ways to get the distortion coefficients. Both imply filming a checkerboard like pattern, then:
In Kinovea, by creating several "Distortion grids", positionning them manually and then clicking "Calibrate camera" in this dialog.
By using Agisoft Lens (freeware), importing the images and performing the (automated) calibration there. Then by importing the resulting XML file in Kinovea through this dialog.
This is a one-time-per-camera operation.
The "Image" tab shows a rectified version of the current image, however it is for ballpark verification, there is currently no plan to provide real time image rectification.
I'll describe in more details later how I verify that the lens distortion and perspective correction are correct.
945 2014-07-11 23:37:02
Re: Canon Hv40 - Streaming HDV (12 replies, posted in Cameras and hardware)
Unfortunately I never had the chance to play with an HDV camera, so I never tested this first hand. I read here and there that grabbing the HDV stream in DirectShow is more involved than for DV, so I'm not convinced it ever worked.
If anyone has a working setup streaming HDV through Firewire in Kinovea please report.