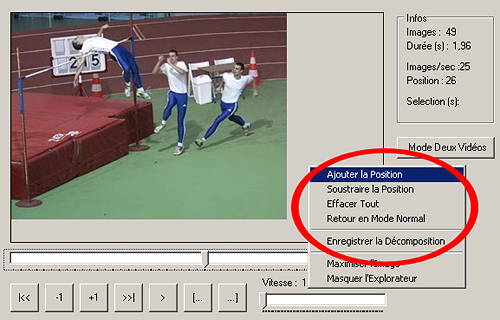
1,006

(2 replies, posted in Français)

Oui, JPEG, PNG, BMP et GIF sont supportés.

1,007

(22 replies, posted in General)

Thanks for the fast feed back !
I'll have a look into the regression on angles as soon as possible.
The grid was previously accessible from the main menu and the shortcut was actually defined on the menu. The menu has been removed so there's no shortcut anymore. I'll definitely look into a more general system to map shortcuts to tools.

And thanks for the support !

1,008

(7 replies, posted in Français)

Version expérimentale, merci de remonter toutes les regressions éventuelles !

Installeur: Kinovea.Setup.0.8.19.exe

Le topic annonce sur le forum anglais.

1,009

(22 replies, posted in General)

Experimental version feedback needed ! wink
Beware of regressions and report anything suspicious. Do not assume the issue is known.

Installer: [s]Kinovea.Setup.0.8.18.exe[/s] Too late! Go check 0.8.19 instead.


New tools
This version is all about new tools. Here is a quick glance at the new tool bar:

http://www.kinovea.org/screencaps/0.8.x/toolbar.0.8.18.png

To access the extra tools on a button, you simply do a long click on the button. (Similar to Adobe Photoshop and other softwares).
The arrow tool has been separated from the line tool for easier access.
Here is a quick summary of the new tools.

http://www.kinovea.org/screencaps/0.8.x/newtools.0.8.18.png

- Auto numbers: to add numbered items. Each time you use it, the number increments.
- Goniometer: lets you measure an angle relatively to a reference angle of 0°, 45°, 90°, etc.
- Posture: lets you check alignments of the body for various sports. The vertical side lines move symmetrically relatively to the center line, the head circle moves up and down, the shoulder line is free, etc.
- Bike fit: for bike fit.
- Profile: to quickly sketch alignments.
- Genu: to quickly sketch the general posture of the lower body. Should be useful for podiatrists. (The name comes from genu flexum, genu recurvatum, etc.)
- Archery top view: as the name implies this one is tailored for archery. the dashed line corresponds to the shoulder line as seen from above.
- Spotlight: puts the focus on an area, dim the rest. See in action.

SHIFT modifier
The shift modifier can be used to constraint how the handles moves. For many tools this will constraint a line to be rotated by 45° jumps relatively to its parent line.
For the pencil tool, it will draw horizontal or vertical lines. For the grid tool, it will constraint to a square.

But wait, there's more
All the tools under the goniometer menu are dynamically loaded from XML description files. This is the core innovation of this version. A generic system to describe, parse and render interactive tools.

The idea in the back of my head here is that in addition to the built-in tools, you'd be able to design your own tools, perfectly tailored to your sport or exercise. This has always been a pet peeve of mine, with the Observational Reference system also in this vein, but here I think it'll be more practical.

Currently it's somewhat crude, you have to create an XML file manually describing the tool and how it behaves. But it's doable (if you know the format).
I'll later write a tutorial on how to create your own tool. And maybe if there's enough demand, I think it'd be possible to have an WYSIWYG editor to create interactive tools.
In the meantime, you can play, copy and alter the files under the "DrawingTools" directory of the installation path. The files in this directory will be automatically loaded in the interface.

If you have a request for a specific tool that you think can be implemented under this system, don't hesitate to post the request on the forum. It'll be an opportunity to show how to do it and hopefully as many users as possible become knowledgeable in this part of the program and can help others and report new ideas to make it even more powerful.

And more
On top of this, please welcome the Czech locale and the Korean locale ! Woohoo, thanks to  Ji?í Rosický and Rak Joon Sung!


Go grab it ! smile

1,010

(1 replies, posted in Bug reports)

First of all, just in case it works in your scenario, you can save the analysis data independently from the video itself. This is the preferred way to go in new versions. Save the analysis in a separate kva file, and use the original footage. The data will be loaded back when reopening the file in Kinovea.
Saving the video itself should only be used for export, for example to upload to youtube or something. Even if it's to share with someone, it's better to send the original video and the .kva file separately.

If this is not possible, try to convert the original video to another format in a conversion software first. (VLC may be able to do it for example). I think the issue with saving is only on certain input formats (mp4 ?) so converting it first to mpeg or avi might fix the problem.

You can also try with the experimental version 0.8.17, although I doubt it will fix the issue, it's more recent and the player has been improved. It also has logs enabled by default, so it'll be easier to diagnose the problem.
(However the data format has changed, so work you do on 0.8.17 may not be entirely read back in 0.8.15)

1,011

(26 replies, posted in General)

marchello wrote:

1. Question.: I'm using GPS logger. And i would like to put the "speed" datas and the video together. So i want to see the video and actual speed in the same time. I'm using kinovea for skiing. Anyone any idea, how could i do that? If its not possible with Kinovea than some other program?

Sorry for being so late to reply.
Do you (or someone else interested in this) have a sample file of the data output by the GPS logger ?
I can't promise anything but the ability to import data logs to overlay and synchronize them on the video is a recurring request.

Actually even better would be if someone could study the various formats existing, if there is a de facto standard, if there is utilities to convert between them, if there is a generic format for data logs outside of GPS theme, etc.

Great stuff !
Thanks for sharing big_smile

1,013

(1 replies, posted in Bug reports)

Thanks, I reproduce the problem. The code that deactivates the keyboard handling is only run when the dialog pops up, I'll see what can be done.

1,014

(7 replies, posted in Bug reports)

The original issue (in this thread at least) was due to a bug in the specific mode of saving where you save the analysis data embedded in the video file as a stream. If you didn't use this feature it must be a different issue. In the new versions, it's only possible to save the analysis as a separate file, partly to avoid this type of problems.

1,015

(7 replies, posted in Bug reports)

If the file is small, send it over (joan at kinovea dot org).
For info the ability to save the KVA embedded inside the MKV has been removed in further versions, it was causing more problems than solving.

1,016

(1 replies, posted in Français)

Bonjour,
Lors du tracking il y a un point ajouté par image, le taux d'échantillonnage est donc équivalent au nombre d'images par seconde de la vidéo.
(Si j'ai bien compris la question)

Chas Tennis wrote:

In your example, is the analyst manually identifying the blurry ball images and placing a marker?  So that with given a set of sparse markers with some missing frames a track is to be placed?

Yes. For cases when the video quality is insufficient and can't be improved.
It wouldn't be a track in the same sense as the track tool though, just a curve spanning multiple frames.

What doesn't satisfy me entirely with rebuilding the curve from chronological order, is that it will be very specific to this type of problem. Wouldn't be able to connect dots on the same image for example, while that might be useful in some other instances.
I can't think of a simpler way to express the order in which the curve should be built…

I'm looking at a Squash video, and trying to visualize the ball trajectory.

The ball is going too fast for the camera it was filmed with, so on some frames it's so blurred it's not visible at all. The trajectory tool, even in full manual mode, cannot really be used because of this.
Putting some cross markers doesn't really do what I need, as it doesn't nicely show the ball trajectory.

I think what would be nice is a way to reconstruct a curve from a set of sparse points. A sort of "connect the dots" feature. That would work even if the points sequence misses several frames in a row.
One way to do it would be to connect the markers by chronological order. (Triggered by a right click menu on any marker maybe). For example it could connect all the markers of a specific color, so as to allow several such reconstructed lines in the same sequence.
Another way would be to have a dedicated tool maybe.

Please add your input.
Did you ever found yourself in similar situation ? What do you think would be a sensible way to handle it ?

Considering the general case where the lines supporting the two segments are secant, even if it's outside the view. The crossing creates 4 angles, (only two different values).
The problems are, how does the user choose which of these angles to display, and where to display it. Each segment can be anywhere relatively to the other, so the positioning of the angle is not straightforward… crossing can be inside the view or not.

jonh wrote:

The horizontal/vertical measuring tool is an excellent tool if I am looking for lets say the horizontal distance between 2 points that may not be the same distance above the ground or for instance for stride length, where I don't want to measure the path travelled but only the distance over the ground, see image.

Ok. If I try to generalize, what you are measuring is the projection of both hooves on a projection plane, the ground. If the ground was tilted (for example a runner on an inclined treadmill), the whole figure would be at an angle. If this is correct it might be more powerful to have this as a rectangle that you can orient, the base being aligned with the projection plane and the interesting points aligned somewhere along the sides of the rectangle.
If possible/desirable, something like this:
http://www.kinovea.org/screencaps/0.8.x/projectedmeasure.png
(blue cross are the interest points, and the line with arrows would be the measurement line and would only be allowed to slide perpendicularly to the base plane).
Just a quick schema though, not worth it if it adds unnecessary complexity for user.

jonh wrote:

For the angle between 2 lines tool the other package I have used has a button for this tool which puts 2 lines onto the screen with the angle between them already calculated, you can then drag the end of these lines to the points you require & the value changes in real time.

What would be the best place to display the angle ?

Also, how to resolve the ambiguity:
http://www.kinovea.org/screencaps/0.8.x/nonsecantangle.png