Angle-angle diagram
Description
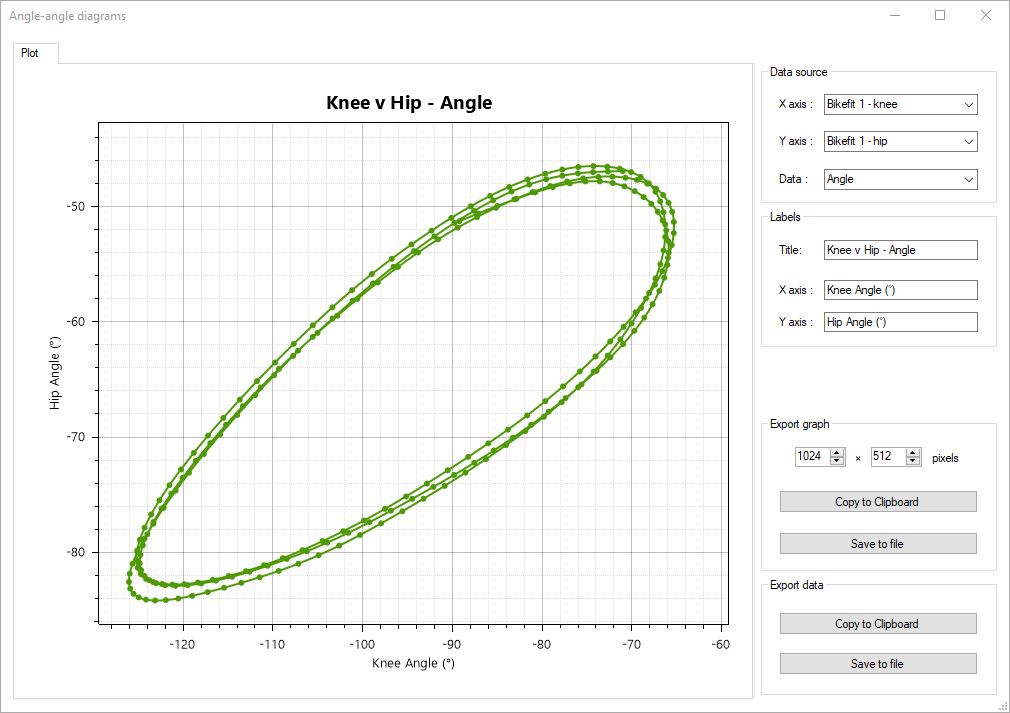
The angle-angle diagram is a qualitative plot showing the dynamics of a movement pattern over multiple trials. This type of diagram correlates two angular measurements over time to highlight their interaction.
For example, this can be used to study the coordination of the knee and hip during flexion or extension.
Data source
The data source lists the angle objects that are plotted on each axis.
Data type
The data type drop down sets the kinematic quantity used for the variable-variable chart. The following options are available:
Angle
Angular velocity
Tangential velocity
Export options
The data can be exported to an image or to tabular data. For tabular data, the output has only two columns, correlating the first angle value with the second value at the same point in time.