Angular kinematics
Description
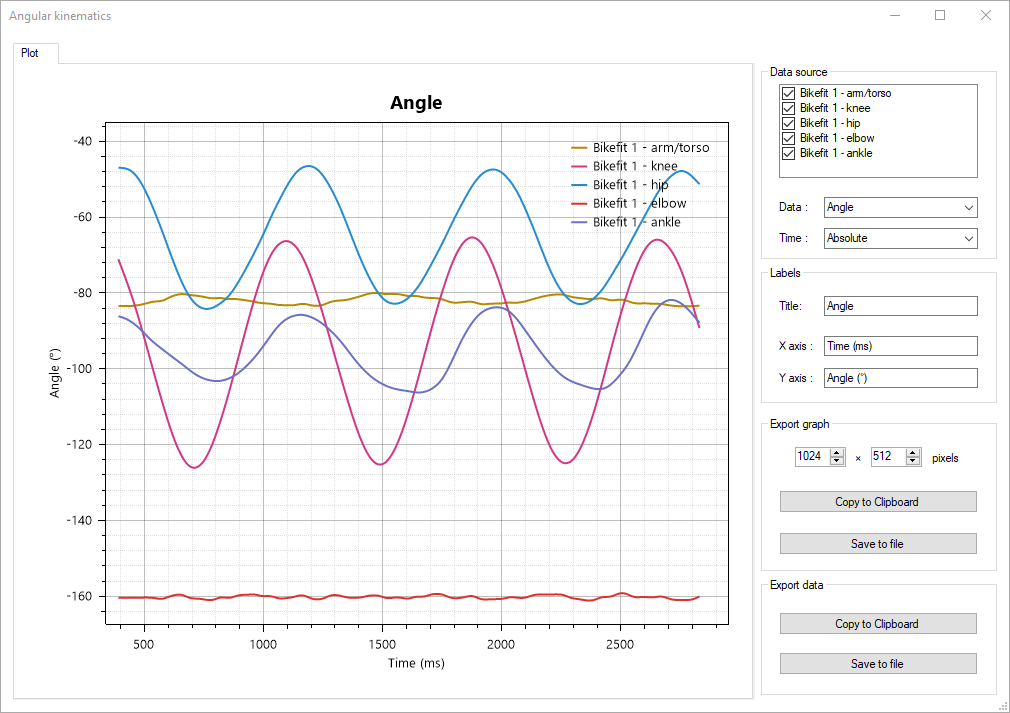
The angular kinematics diagram displays line charts of tracked angles.
This can be used to study and compare the evolution of angle, angular speed or angular acceleration over time.
Data source
The data source list contains a list of all tracked angles. Data from individual angles can be hidden from the line chart by unchecking the checkbox in front of the point name.
Data type
The Data type drop down sets the kinematic quantity used in the line chart. The following options are available:
Angle
Total displacement
Angular velocity
Tangential velocity
Angular acceleration
Tangential acceleration
Centripetal acceleration
Resultant acceleration
Note
Be mindful that acceleration values are very sensitive to noise as they are the second derivative of the digitized position.
Time type
The Time type drop down sets the time scale used in the line chart. The following options are available:
Absolute: times are in normal video time.
Relative: times are expressed relatively to the start of each trajectory.
Normalized: times are expressed as a fraction of each trajectory duration.
Relative time aligns events to their start, this can be used to compare trajectories that did not occur at the same time in the video.
Normalized time can be used to compare the shape of time series that did not last the same duration.
Export options
The data can be exported to an image or to tabular data. For tabular data the points are sorted by time, the first column is the time in milliseconds, the other columns are values from the time series.