Scatter diagram
Description
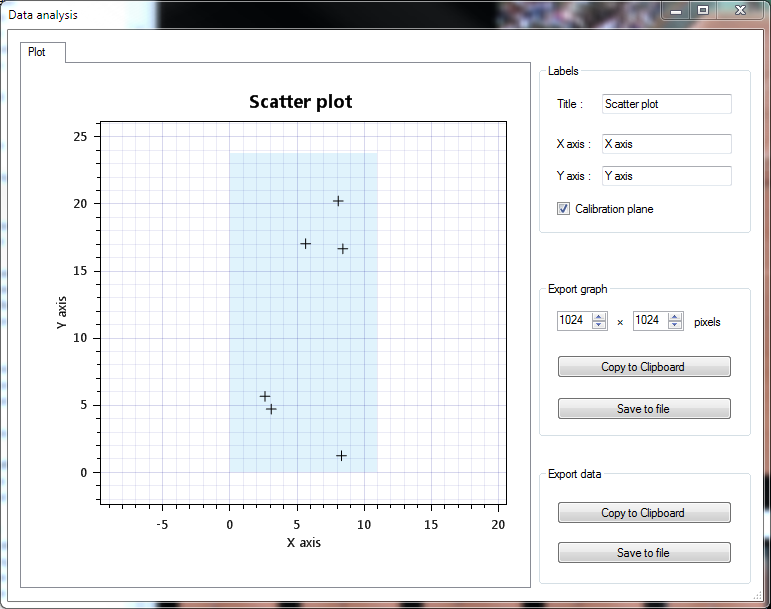
The scatter diagram displays the positions of the marker objects in the video. The axes are based on the calibrated coordinate system.
This can be used to get a bird’s eye view of the contact points of a ball on the ground for example.
Data source
The data source is the whole set of marker objects.
Calibration plane
This option highlights the area covered by the perspective grid used to calibrate the coordinate space.
Export options
The data can be exported to an image or to tabular data. For tabular data the points are sorted by time; the first column is the time in milliseconds, the second and third columns are the X and Y positions.